Shopify Loyalty App Reviews Study 2026: What 3,410 Merchant Reviews Reveal About Complaints and Praise
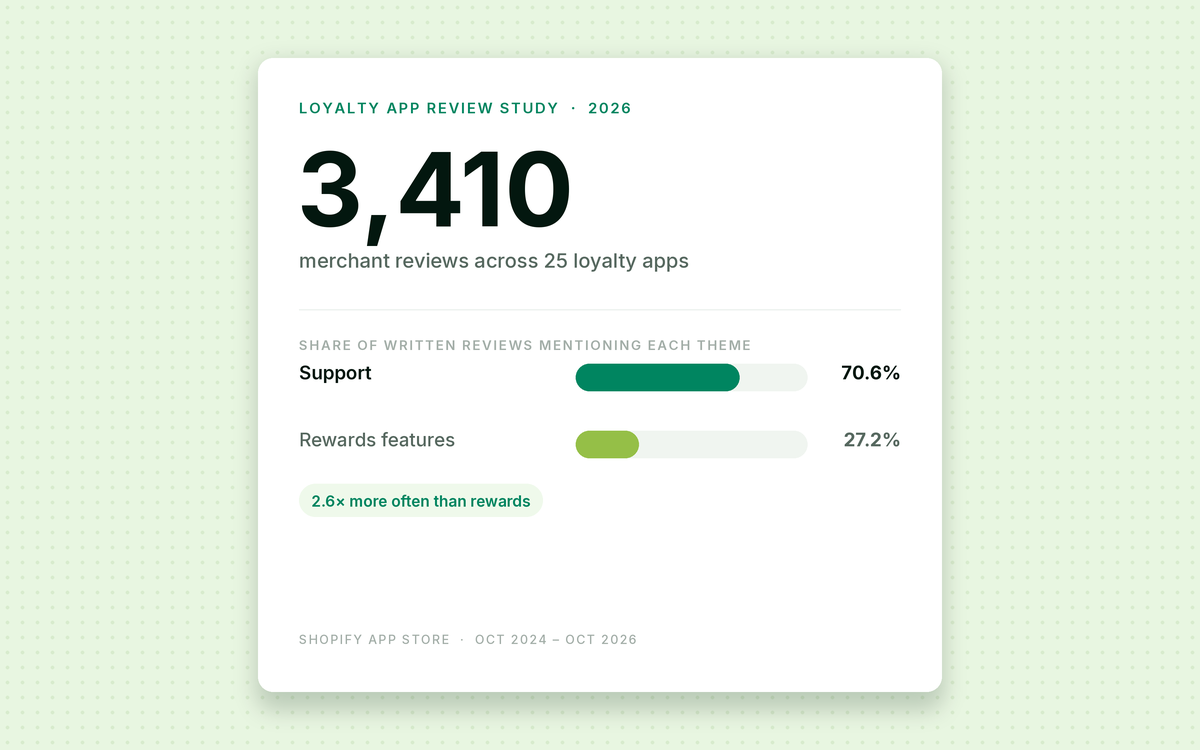
We read 3,410 Shopify App Store reviews of 25 loyalty, rewards, referral and store-credit apps to find out what merchants actually talk about after they install one. We also studied a separate set of 154 one- and two-star reviews to see what goes wrong when an app disappoints.
The short version: merchants talk about support far more than they talk about points or VIP tiers, and almost all of it is praise. When reviews turn negative, the complaints are mostly about support, pricing and bugs.
On this page
- Key findings
- Citable statistics
- Why we ran this study
- How we did it
- Finding 1: Support dominates loyalty app reviews
- Finding 2: Customization comes up less than you might expect
- Finding 3: Rewards mechanics come second, far behind support
- Finding 4: Setup and reliability are praised in good reviews and blamed in bad ones
- Finding 5: Pricing is the biggest source of negative reviews
- Finding 6: Integrations and business results are rarely discussed
- Finding 7: Merchants either love a loyalty app or give it one star
- Finding 8: A few apps account for most negative reviews
- Finding 9: About 1 in 50 reviews describe switching from another app
- Finding 10: What merchants report about revenue, ROI and repeat orders
- Finding 11: Reviews are written early, and long-term users are more critical
- Finding 12: One in three reviews thanks a support agent by name
- Finding 13: Most mentions are praise, but pricing draws complaints
- Finding 14: Why merchants praise or complain about each theme
- Finding 15: What one- and two-star reviews actually complain about
- Finding 16: What merchants report when leaving an app or changing plans
- What changed between the two years
- Main sample versus one- and two-star reviews
- Results by app
- What merchants wrote
- What this means if you’re choosing a loyalty app
- Limitations
- Full methodology
- Download the data
- Frequently asked questions
- How to cite this study
- Appendix: reasons behind praise and complaints
- About the author
Looking for a specific app? See the app-by-app results.
Key findings
- Support is the most discussed topic by a wide margin. 70.6% (±1.6 points) of reviews with written comments mentioned support, customer service, help or response times.
- Rewards mechanics come a distant second. 27.2% (±1.6) mentioned points, VIP tiers, referrals, cashback or store credit.
- Customization and branding came up in only 13.8% (±1.2) of written reviews, about 1 in 7.
- Setup (19.7%) and reliability (17.8%) each came up in roughly one in five written reviews.
- Pricing appeared in just 7.7% (±1.0) of written reviews overall, but in 43.3% (±7.8) of written one- and two-star reviews, 5.6 times as often (95% range 4.5 to 7.0 times). That’s the biggest jump of any theme.
- Reliability and technical problems were mentioned in 36.7% (±7.6) of written one- and two-star reviews, about double the rate in reviews overall.
- Business results are rarely mentioned. Only 6.8% of written reviews talked about sales, retention, conversions, AOV or ROI.
- Merchants either love a loyalty app or give it one star. 94.4% of sampled reviews were five-star, only 0.4% were three-star, and one-star reviews outnumbered three-star reviews 7 to 1.
- Unhappy merchants skip straight to the bottom: 88.3% of one- and two-star reviews were one-star, and 97.4% included a written explanation, compared with 86.8% of all reviews.
- Negative reviews are concentrated. Four of the 25 apps accounted for 54% of all one- and two-star reviews, while 14 apps had three or fewer in two years.
- Support was one of the two most mentioned themes for all 25 apps. Pricing wasn’t a top-two theme for any app, even though it appears in 43.3% of negative reviews.
- About 1 in 50 reviews (2.0%) describe switching from another app. Yotpo (7), Smile.io (5) and Stamped (4) are the apps switchers name most often as the one they left, and 86% of switching reviews praise the support or migration help they got.
- Outcome language appears in 6.8% of reviews, but only 1.4% describe an actual result for the merchant’s own store, such as more repeat orders, more revenue or a positive ROI. Only 3 of 2,961 reviews put a number on it.
- Reviews are written early: 28.8% within a week of installing and 17.1% on day one. Merchants who had used an app for over a year were twice as likely to leave one or two stars (4.7% vs 2.2%) and mentioned reliability 2.2 times as often as first-week reviewers.
- About 1 in 3 written reviews (33.7%) thank a support agent by name, rising to 80.6% for one app, a strong sign that many reviews are requested right after a support chat.
- Most mentions are praise. Only 2.6% of support mentions are complaints, against 22.8% of pricing mentions and 11.2% of reliability mentions.
- When we read all 150 written one- and two-star reviews, the most common complaints were slow or unhelpful support (39.3%, ±7.7), pricing, plans or billing (38.0%, ±7.7) and bugs (31.3%, ±7.3).
- 17 reviews describe problems when leaving an app or changing plans: being charged after uninstalling or cancelling, code left on the store, or reviews and points lost.
- When merchants praise support, it’s mostly for fast replies (42%) and setup or migration help (21%). When they complain about pricing, it’s about the price itself (30%), charges, refunds or cancelling (29%) and features locked behind higher plans (25%).
Figures in brackets are 95% margins of error in percentage points. Main-sample figures (2,961 written reviews) are accurate to within about ±1 to ±2 points; figures from the 150 one- and two-star reviews to within about ±5 to ±8 points. See margins of error.
Citable statistics
You can use any of these statistics in your own work. Please link to this page as the source.
Shopify loyalty apps as a category
- Magicbean’s analysis of 3,410 Shopify App Store reviews across 25 loyalty apps found that merchants mention support 2.6 times more often than rewards features (70.6% vs 27.2% of written reviews).
- 7 in 10 merchants (70.6%) who write a loyalty-app review mention support, making it the most discussed topic by a wide margin.
- Rewards features are the second most discussed topic, but far behind support: 27.2% of written loyalty-app reviews mention points, VIP tiers, referrals or store credit.
- Only about 1 in 7 written loyalty-app reviews (13.8%) mention customization, branding or design.
- Setup (19.7%) and reliability (17.8%) each come up in about 1 in 5 written loyalty-app reviews, more than twice as often as pricing (7.7%).
- Fewer than 1 in 10 merchants (8.4%) mention integrations such as email, SMS, WhatsApp or Shopify Flow in their loyalty-app review.
- Only 1 in 15 written loyalty-app reviews (6.8%) mentions sales, retention, conversions, AOV or ROI, compared with 70.6% that mention support.
- 94.4% of Shopify loyalty-app reviews are five-star and only 2.9% are one or two stars, so star ratings barely separate one app from another.
- 13.2% of merchants who review a Shopify loyalty app leave a star rating with no written comment.
- Shopify loyalty-app ratings are polarized: one-star reviews outnumber three-star reviews 7 to 1 (2.5% vs 0.4%), and only 2.3% of reviews are four-star.
- Merchants mention support about 10 times more often than business results in loyalty-app reviews (70.6% vs 6.8%).
- Support is one of the two most mentioned themes for all 25 Shopify loyalty apps; rewards mechanics is for 15, reliability for 6, and pricing for none.
- 97.4% of support mentions in Shopify loyalty-app reviews are praise or neutral; only 2.6% are complaints.
- When merchants praise loyalty-app support, 42% of the time it’s for fast replies and 21% for help with setup or migration.
- Only 14% of reliability praise in loyalty-app reviews is about an app simply working without issues; 56% is about an issue that support fixed quickly.
- Pricing complaints about Shopify loyalty apps split three ways: the price itself (30%), charges, refunds or cancelling (29%), and features locked behind higher plans or order limits (25%).
- Pricing is the most criticised topic when it comes up: 22.8% of pricing mentions in loyalty-app reviews are complaints, compared with 2.6% of support mentions.
- 17 Shopify loyalty-app reviews describe problems when leaving an app or changing plans, including being charged after uninstalling, code left on the store, and reviews or points lost.
- Support mentions vary more than threefold between loyalty apps, from 36.5% to 86.3% of written reviews; 15 of the 23 apps with 40+ written reviews sit above the 70.6% average.
- About 1 in 50 Shopify loyalty-app reviews (2.0%) describe switching from another app, and every one of those switching reviews is five-star.
- Yotpo is the app merchants name most often as the one they switched away from (7 mentions), ahead of Smile.io (5) and Stamped (4).
- 86% of reviews describing a switch between loyalty apps praise the support or migration help, while 22% mention price or cost savings.
- Outcome language appears in 6.8% of Shopify loyalty-app reviews, but only 1.4% describe an actual result for the merchant’s own store.
- Repeat purchases and retention are the result merchants report most often: 24 of the 42 reviews that describe a concrete result mention repeat orders, retention or customer lifetime value, compared with 16 that mention revenue or sales and 4 that mention ROI.
- Only 3 of 2,961 written Shopify loyalty-app reviews put a number on the business result they saw.
- 28.8% of Shopify loyalty-app reviews are written within a week of installing the app, and 17.1% on the first day.
- Merchants who have used a loyalty app for over a year are twice as likely to leave a one- or two-star review as newer users (4.7% vs 2.2%).
- Merchants with more than a year of use mention reliability 2.2 times as often as first-week reviewers (25.0% vs 11.4%), while setup mentions fall from 24.2% to 9.8%.
- About 1 in 3 written Shopify loyalty-app reviews (33.7%) thank a support agent by name, compared with 2.0% of one- and two-star reviews.
- Reviews in the study came from merchants in 91 countries; 34.6% were from the United States, followed by the United Kingdom (8.6%) and Australia (7.0%).
When loyalty apps disappoint (separate set of one- and two-star reviews)
- Pricing comes up in 43.3% of one- and two-star loyalty-app reviews but only 7.7% of reviews overall, making it 5.6 times more common when merchants are unhappy.
- Technical problems double in negative reviews: 36.7% of one- and two-star loyalty-app reviews mention reliability or bugs, versus 17.8% of reviews overall.
- Support is still the most common topic in negative reviews (46.7%), ahead of pricing (43.3%) and reliability (36.7%).
- Read one by one, 39.3% of one- and two-star loyalty-app reviews complain about slow or unhelpful support, 38.0% about pricing, plans or billing, and 31.3% about bugs.
- Customization rarely drives negative reviews: only 8.0% of one- and two-star loyalty-app reviews mention it.
- When merchants are unhappy with a loyalty app, they go straight to one star: 88.3% of one- and two-star reviews are one-star, compared with 11.7% two-star.
- Unhappy merchants explain themselves: 97.4% of one- and two-star loyalty-app reviews include a written comment, versus 86.8% of reviews overall.
- Negative reviews are concentrated: four of 25 loyalty apps (Smile.io, Stamped, Okendo and Rivo) account for 54% of all one- and two-star reviews in two years, while 14 apps had three or fewer.
- Merchants are more than twice as likely to mention sales or revenue in a one- or two-star review (15.3%) as in reviews overall (6.8%).
Individual apps
App-specific statistics for all 25 apps are on the app-by-app results page.
Why we ran this study
Most loyalty app comparisons are built from feature lists and vendor claims. Those tell you what an app can do. They don’t tell you what it’s like to install, customize, pay for and get help with.
Shopify App Store reviews fill that gap. They’re written by merchants who run the software on real stores, and they’re public. We wanted a structured, repeatable way to read them across the whole category instead of picking out the reviews that support a particular story.
How we did it
We collected reviews from the official Shopify App Store listing of each of the 25 apps. To keep the comparison current, we used two 12-month windows:
- Recent period: 3 October 2025 to 3 October 2026
- Previous period: 3 October 2024 to 2 October 2025
For each app we randomly sampled up to 120 reviews from the recent period and up to 80 from the previous period, with a fixed random seed. That caps every app at 200 reviews, so the biggest apps don’t drown out the smaller ones. Apps with fewer eligible reviews contributed what they had.
The 60/40 split gives the current version of each app a slightly stronger voice while still keeping a year of history. Loyalty apps change pricing, checkout features and integrations often, and we didn’t want a single good or bad month to dominate.
Of the 3,410 reviews, 2,961 had written comments. The other 449 were star ratings with no text, so they count toward rating totals but not toward any theme.
We then tagged each written review for 11 themes using transparent keyword rules (listed in full in the methodology section below). A review can carry several themes. A support mention, for example, might be praise or a complaint; the tag records that the topic came up. Finding 13 then sorts each mention into praise or complaint.
Because only 99 of the 3,410 sampled reviews were one or two stars, we also collected a separate set of 154 low-rated reviews from the same date windows. This set exists to study complaints in more depth. It partly overlaps with the main sample, so the two sets are never added together.
Finding 1: Support dominates loyalty app reviews
70.6% of written reviews mentioned support. Nothing else comes close.
Bar chart: support is mentioned in 70.6% of written loyalty-app reviews, followed by rewards mechanics 27.2%, setup 19.7%, reliability 17.8%, customization 13.8%, integrations 8.4%, pricing 7.7% and business results 6.8%.
Many of these reviews thank a support agent by first name. One Smile.io merchant wrote: “10/10 customer service—fast, helpful, and straight to the point. Lynn assisted me tonight and kindly answered every question with the exact information I needed.” (Heart of Gold Kids, 5★, 1 Oct 2026 · Shopify App Store)
That pattern suggests a lot of reviews are written right after a support chat, probably because vendors ask for them at that moment. So the high support share partly reflects how reviews get collected. Even so, it tells you something real: for most merchants, the support team is the part of a loyalty app they remember.
Almost all of it is praise. Of the 2,091 support mentions, 1,965 are positive and only 55 (2.6%) are complaints.
Support also stays at the top of negative reviews. 46.7% of written one- and two-star reviews mentioned support, usually slow replies, chatbots, or copy-paste answers that didn’t fix the problem.
Finding 2: Customization comes up less than you might expect
13.8% of written reviews mentioned customization, branding, themes, widgets, design, language or developer work. That’s about 1 in 7, half the rate of rewards features (27.2%).
When merchants do raise it, they’re usually pleased: 382 of the 408 mentions (93.6%) are praise. “Very easy to set up and customize,” wrote one Essent Loyalty merchant. (Invisalign Accessory Store USA, 5★, 7 May 2025 · Shopify App Store)
Customization also rarely drives negative reviews. It came up in only 8.0% of written one- and two-star reviews. Design matters most for apps that also run customer accounts or wishlists, such as Froonze (38.0%) and Flits (30.6%).
Finding 3: Rewards mechanics come second, far behind support
Points, VIP tiers, referrals, cashback and store credit are what loyalty apps sell. Yet only 27.2% of written reviews discussed them.
The reviews that do tend to be practical. A Love Loyalty merchant described what worked for a first program: “One of the advantages is that customers can redeem points for a discount % on their next order.” (La Jewelista, 5★, 5 May 2025 · Shopify App Store)
Our reading is that most loyalty apps cover the basic mechanics well enough that merchants rarely comment on them. 739 of the 804 rewards mentions (91.9%) are praise. The differences merchants notice are in support, reliability and price.
Finding 4: Setup and reliability are praised in good reviews and blamed in bad ones
Setup or onboarding came up in 19.7% of written reviews, and reliability or technical performance in 17.8%. In the main sample, most of these mentions were positive (92.8% of setup mentions are praise), along the lines of “Simple to setup!” (self., 5★, 23 Sep 2026 · Shopify App Store)
Reliability is where complaints start to show. 11.2% of reliability mentions in the main sample are complaints, against 2.6% for support. In low-rated reviews, reliability and technical problems were mentioned in 36.7% of written comments. Merchants described bugs, failed setup, broken domain verification and conversion drops. One Gameball merchant wrote that the app kept showing an error saying “something went wrong” and that support replied late with steps they’d already tried. (Petfast.shop, 1★, 26 Oct 2025 · Shopify App Store)
Finding 5: Pricing is the biggest source of negative reviews
Pricing, billing, plans, charges, refunds and cancellation came up in only 7.7% of written reviews overall. In written one- and two-star reviews, the figure was 43.3%, 5.6 times higher. It’s also the most criticised topic in the main sample: 22.8% of pricing mentions are complaints.
The complaints are mostly about price rises, plan limits, features behind paywalls, charges after cancellation and refused refunds. A Marsello merchant described a $200 price increase to $525 a month, and prepaid SMS credits that were set to expire. (Tonique Skincare, 1★, 2 Oct 2026 · Shopify App Store)
The headline monthly price is only part of the cost. What happens when you outgrow a plan, cancel, or need a feature on the next tier up matters just as much.
Finding 6: Integrations and business results are rarely discussed
8.4% of written reviews mentioned integrations such as email, SMS, WhatsApp, APIs, Shopify Flow or named platforms. 6.8% mentioned business results like sales, retention, conversions, repeat purchases, AOV, LTV or ROI.
The low outcome figure is worth noting for anyone reading loyalty app marketing. Merchants who say an app “increased conversions” are making a claim about their own store, and those claims are uncommon in public reviews. None of the figures in this study show that an app caused a sales result.
Finding 7: Merchants either love a loyalty app or give it one star
Loyalty-app ratings sit at the two extremes. Of the 3,410 reviews we sampled, 94.4% were five-star and 2.5% were one-star. Everything in between added up to just 3.1%, and three-star reviews (12) were outnumbered by one-star reviews (86) about 7 to 1.
Bar chart of star ratings: 3,220 five-star reviews (94.4%), 79 four-star (2.3%), 12 three-star (0.4%), 13 two-star (0.4%) and 86 one-star (2.5%).
The separate set of low-rated reviews shows the same pattern. 88.3% of those 154 reviews were one-star; only 18 were two-star. And unhappy merchants write more: 97.4% of one- and two-star reviews included a written comment, compared with 86.8% of reviews overall.
That’s useful for anyone comparing apps. Star averages bunch near the top for almost every loyalty app, so the written text of the few negative reviews is where the real differences show up.
Finding 8: A few apps account for most negative reviews
One- and two-star reviews aren’t spread evenly. Smile.io (24), Stamped (22), Okendo (21) and Rivo (16) together accounted for 83 of the 154 low-rated reviews in the two-year window, or 54%. At the other end, 14 of the 25 apps had three or fewer, and six had none at all.
Bar chart of one- and two-star reviews per app: Smile.io 24, Stamped 22, Okendo 21, Rivo 16, Yotpo 10, Ryviu 10, Rise 9, Growave 8, LoyaltyLion 8, Joy 7, then 4 or fewer for the remaining apps.
Read this with care. Apps with more installs get more reviews of every kind, so a higher count partly reflects size. The pattern says where negative experiences have been written about most, not which app is worst.
Finding 9: About 1 in 50 reviews describe switching from another app
59 of the 2,961 written reviews (2.0%) describe moving to the reviewed app from another loyalty, referral or review app. Another 27 say the merchant tried or compared several apps before choosing. Together that’s 86 reviews (2.9%) that mention another app in a buying decision.
We read every review that matched our switching keywords and kept only genuine app-to-app moves. Moving a store from Wix, Magento or WooCommerce to Shopify, or upgrading to a new version of the same app, doesn’t count.
In 22 of the 59 switching reviews, the merchant named the app they left. Yotpo came up most often.
Bar chart: apps named as the one merchants switched away from. Yotpo 7, Smile.io 5, Stamped 4, Square or Lightspeed 2, and Influence.io, LoyaltyLion, Rise.ai and SE Wishlist 1 each.
Among loyalty apps, the switches we found landed most often at Love Loyalty (8), BON Loyalty (8), LoyaltyLion (5) and Appstle Loyalty (5). Okendo had 12, but most of those were merchants moving their product reviews rather than their loyalty program.
A BON Loyalty merchant wrote: “We recently switched from Smile.io to BON Loyalty for my Shopify store.” (GULLYDESIGN, 5★, 19 May 2026 · Shopify App Store) A Stamped merchant gave the reason in a few words: “We switched over to Stamped from Yotpo for cost savings.” (Opopop, 5★, 29 May 2025 · Shopify App Store)
What switchers talk about most is help with the move. 51 of the 59 (86%) praise the support or migration team, often for importing customers and point balances. Only 13 (22%) mention price or cost savings.
All 59 switching reviews are five-star. That’s partly because switches show up in the happy review a merchant leaves at their new app. Merchants who leave an app rarely say so in a review, so this measures successful switches, not how often merchants churn.
Finding 10: What merchants report about revenue, ROI and repeat orders
Outcome language shows up in 6.8% of written reviews, but most of it is general description (“a great way to encourage repeat purchases”) or hope (“looking forward to seeing our repeat customer rate increase”). We read each one and kept only reviews that describe an actual result for the merchant’s own store.
That leaves 42 reviews, or 1.4% of the 2,961 written reviews. Here’s what those 42 describe (some mention more than one):
| Result described | Reviews |
|---|---|
| More repeat purchases, better retention or higher customer lifetime value | 24 |
| More revenue or sales | 16 |
| Positive ROI or “pays for itself” | 4 |
| Higher average order value | 2 |
| Higher conversion rate | 2 |
Repeat orders and retention come up more often than revenue. That fits what loyalty programs are built to do, but it’s still the merchant’s own account, not a measured result.
Only 3 reviews put a number on the result. A Nector merchant wrote: “our Sales boost up by 28% and repeat rate increase by 40% overall.” (WalletKart.in, 5★, 2 Jul 2026 · Shopify App Store) A LoyaltyLion merchant said “redeeming members spend 5x more than non-members.” (esmi, 5★, 10 Sep 2025 · Shopify App Store) A Love Loyalty merchant reported about $5,000 of membership sales within 30 days of going live. (Félix & Norton, 5★, 2 Sep 2025 · Shopify App Store)
The other side shows up too. In the separate set of one- and two-star reviews, 6 of 150 (4.0%) said the app hadn’t paid off, including an Okendo merchant who wrote “ROI on it is minimal.” (PK9 Gear, 1★, 10 Mar 2026 · Shopify App Store)
If you want evidence that loyalty programs increase repeat purchases, independent research is the better source. Reviews tell you how often merchants say they’ve seen results, and in this sample that’s rare.
Finding 11: Reviews are written early, and long-term users are more critical
Every Shopify review shows how long the merchant had been using the app. 17.1% of the reviews in our sample were written on the day of install, 28.8% within the first week and 42.2% within the first month. The typical reviewer had used the app for about two months.
So a large share of loyalty-app reviews describe setup and first impressions, not what it’s like to run a program for a year. And the longer merchants had used an app, the more critical they were.
Three bar charts by how long the merchant had used the app. Setup mentions fall from 24.2% in the first week to 9.8% after a year. Reliability mentions rise from 11.4% to 25.0%. One- and two-star ratings rise from about 2% to 4.7% after a year.
Merchants who had used an app for over a year were twice as likely to leave one or two stars (4.7% vs 2.2% for everyone else). They mentioned reliability more than twice as often as first-week reviewers (25.0% vs 11.4%), and setup much less (9.8% vs 24.2%). In the separate low-rated set, 38.3% of reviews came from merchants with more than a year of use, compared with 26.8% of all reviews.
If you’re comparing apps, the reviews from long-term users are worth seeking out. They’re the closest thing to a report on how an app holds up.
Finding 12: One in three reviews thanks a support agent by name
33.7% of written reviews name the support person who helped. Among five-star reviews it’s 34.9%. Among one- and two-star reviews it’s 2.0%.
The rate varies a lot between apps. 80.6% of Yotpo Loyalty’s written reviews name an agent, as do 65.2% of Joy Loyalty’s and 62.0% of LoyaltyLion’s. At Essent Loyalty it’s 3.9%.
Such a big gap between apps suggests that some vendors ask for a review right after a support conversation goes well. It doesn’t make those reviews fake, but it does mean support-heavy, five-star reviews partly reflect when and how reviews are requested. It’s one reason support is the top theme in this study.
Finding 13: Most mentions are praise, but pricing draws complaints
A theme tag only says a topic came up. So we also sorted every theme mention in the main sample into praise, complaint, or mixed and unclear.
| Theme | Mentions | Praise | Complaint | Mixed or unclear | Complaint share |
|---|---|---|---|---|---|
| Support | 2,091 | 1,965 | 55 | 71 | 2.6% |
| Rewards | 804 | 739 | 30 | 35 | 3.7% |
| Setup | 583 | 541 | 24 | 18 | 4.1% |
| Reliability | 527 | 438 | 59 | 30 | 11.2% |
| Customization | 408 | 382 | 14 | 12 | 3.4% |
| Integrations | 248 | 218 | 23 | 7 | 9.3% |
| Pricing | 228 | 165 | 52 | 11 | 22.8% |
Support is overwhelmingly positive: only 2.6% of support mentions are complaints. Pricing is the opposite. When merchants bring it up, 22.8% of the time it’s a complaint, and reliability follows at 11.2%. So pricing is rarely mentioned, but it’s the most likely topic to be a sore point when it is.
Finding 14: Why merchants praise or complain about each theme
Knowing that a mention is praise or a complaint still leaves the question of why. So we sorted every praise and complaint mention by the reason it gives.
Across all six themes, here is what drives praise and complaints:
- Support praise is mostly about fast replies (42%), then help with setup or migration (21%), friendliness, expertise and actually solving the problem (14% each). Support complaints are mostly about slow or no replies (35%), problems left unfixed (13%) and chatbots or scripted answers (10%).
- Pricing praise is mostly about good value (21%) and the free plan (12%), but over half of pricing praise gives no specific reason. Pricing complaints split three ways: too expensive (30%), charges, refunds or cancelling (29%), and features locked behind a higher plan or order limit (25%), with price rises and misleading pricing at 12% each.
- Reliability praise is usually an issue that support fixed quickly (56%); only 14% praise the app for simply working without issues. Reliability complaints are about bugs and errors (29%), slow loading (19%) and points, emails or syncing not working (19%).
- Setup praise is about guided help (74%) and ease or speed (70%).
- Rewards praise most often names flexible options such as tiers and referrals (30%); 61% of rewards mentions give no specific reason.
- Customization praise is most often about support doing the custom work (43%), then matching the brand easily (33%).
The full reason tables for each theme, with a quote for each, are in the appendix.
How support praise differs by app is on the app-by-app results page.
Method: each praise or complaint mention was matched against a set of reason phrases (for example “quick”, “within minutes” or “prompt” for fast replies; “increase”, “went up” or “no longer free” for a price rise). One mention can give several reasons, and mentions that match none are shown as “no specific reason given”. Complaint reasons use the main sample’s complaint mentions plus the separate one- and two-star set. A hand check of 32 random reason labels found 25 correct (78%); errors were concentrated in the small setup, rewards and customization complaint groups, which are flagged.
Finding 15: What one- and two-star reviews actually complain about
We read all 150 written one- and two-star reviews and recorded what each one complains about. A review can have more than one complaint.
Bar chart: complaint types in 150 written one- and two-star reviews. Slow or unhelpful support 39.3%, pricing, plans or billing 38.0%, bugs or app not working 31.3%, missing features or hard to use 19.3%, problems on uninstall 4.7%, lost data, points or reviews 3.3%.
| Complaint | Reviews | Share of 150 |
|---|---|---|
| Slow, missing or unhelpful support | 59 | 39.3% |
| Pricing, plan limits, charges, refunds or cancellation | 57 | 38.0% |
| Bugs or the app not working | 47 | 31.3% |
| Missing features or hard to use | 29 | 19.3% |
| Problems on uninstall | 7 | 4.7% |
| Lost data, points or reviews | 5 | 3.3% |
Support complaints are mostly about slow replies, chatbots that won’t hand over to a person, and answers that didn’t fix the problem. Pricing complaints cover price rises, features locked behind higher plans, order limits that were misunderstood, and charges after cancelling. Bug complaints describe pages that won’t load or save, widgets that don’t display, and emails or review requests that stop sending.
Finding 16: What merchants report when leaving an app or changing plans
We searched every written review for uninstalling, cancelling, exporting and lost data. 17 reviews, all one or two stars, describe a problem:
| Problem | Reviews | Apps named |
|---|---|---|
| Charged after uninstalling or cancelling | 5 | Growave, Rivo, Ryviu, Smile.io, LoyaltyLion |
| Code or data left on the store after removal | 4 | Okendo (2), Rivo, Growave |
| Reviews, points or customer data lost after a plan change or exit | 4 | Stamped (3), Marsello |
| Couldn’t export reviews without contacting support | 2 | Stamped (2) |
| Couldn’t uninstall the app | 1 | LoyaltyLion |
| Past customers not carried over in a migration | 1 | Joy Loyalty |
A Growave merchant wrote: “I uninstalled but was charged $125? It said if I uninstalled I wouldn’t be charged.” (RunnersWorld Tulsa, 1★, 6 Mar 2025 · Shopify App Store) An Okendo merchant warned that “Metafields are added to the site that can not be removed.” (Bliss Energetics, 1★, 25 Aug 2026 · Shopify App Store) A Stamped merchant said that when the free plan changed, “All these years of reviews I collected were instantly removed from our website.” (SAUBOON Handcrafted Soaps, 1★, 13 Nov 2025 · Shopify App Store)
17 reviews is a small base, so this can’t tell you which app is safest to leave. It does show what to check before you install: how to cancel, what stays on your store after removal, and how to export your customers, points and reviews.
What changed between the two years
Most themes were stable between the previous period (October 2024 to October 2025) and the recent one (October 2025 to October 2026). Pricing (8.6% to 6.9%), reliability (18.4% to 17.3%) and business outcomes (7.0% to 6.6%) barely moved, and the share of one- and two-star reviews stayed within the margin of error (2.6% to 3.2%).
Two themes did fall. Customization mentions dropped from 15.8% to 12.1%, and support mentions from 72.7% to 68.8%.
Inside the one- and two-star set, pricing complaints fell from 50.7% to 36.0%, while support complaints rose from 40.0% to 53.3%. Each period has only 75 written low-rated reviews, so treat these shifts as early signals rather than settled trends.
Main sample versus one- and two-star reviews
This chart compares how often each theme appeared in the 2,961 written reviews of the main sample and in the 150 written reviews of the separate one- and two-star set.
Dumbbell chart comparing theme mentions in all reviews versus one- and two-star reviews: pricing rises from 7.7% to 43.3%, reliability from 17.8% to 36.7%, business results from 6.8% to 15.3%, integrations from 8.4% to 12.0%; rewards falls from 27.2% to 22.0%, customization from 13.8% to 8.0%, setup from 19.7% to 14.0% and support from 70.6% to 46.7%.
The same figures as a table:
| Theme | Main sample | 1–2-star set | Change |
|---|---|---|---|
| Pricing and billing | 7.7% | 43.3% | +35.6 pts |
| Reliability and technical issues | 17.8% | 36.7% | +18.9 pts |
| Reported business outcomes | 6.8% | 15.3% | +8.5 pts |
| Integrations | 8.4% | 12.0% | +3.6 pts |
| Rewards mechanics | 27.2% | 22.0% | −5.2 pts |
| Customization and branding | 13.8% | 8.0% | −5.8 pts |
| Setup and onboarding | 19.7% | 14.0% | −5.7 pts |
| Support | 70.6% | 46.7% | −23.9 pts |
In the one- and two-star set, migration and data transfer (5.3%), redemption problems (5.3%) and POS issues (1.3%) were mentioned less often.
The one- and two-star set was collected on purpose to study complaints. It doesn’t tell you what share of loyalty app reviews are negative.
Results by app
Support was one of the two most mentioned themes for all 25 apps, rewards mechanics for 15, reliability for 6 and pricing for none. Support mentions range from 36.5% of written reviews (CWILL Loyalty) to 86.3% (Yotpo Loyalty).
The full results for each app, including praise vs complaint counts, what each app’s one- and two-star reviews are about, and a quote from each, are on the separate app-by-app results page.
What merchants wrote
These excerpts are copied exactly from Shopify App Store reviews. They illustrate the themes; they don’t represent how common each experience is.
On support, a BON Loyalty merchant wrote: “They are always so quick to respond and genuinely helpful whenever I have questions. Outstanding customer service!” (Pure Tincture Organic Beauty, 5★, 9 Jul 2026 · Shopify App Store)
On switching apps, an Appstle merchant wrote: “I’m very happy so far with my decision to change providers to Appstle!” (Craftique Studio Shop, 5★, 7 Jan 2026 · Shopify App Store)
On in-store loyalty, a YOYO Loyalty merchant wrote: “Kane helped me get our loyalty points setup on the POS quickly this morning.” (Bloom Boutique, 5★, 13 Jan 2026 · Shopify App Store)
On reported results, a LoyaltyLion merchant wrote that the app “has increased customer engagement with our emails and website.” (Goldtop, 5★, 8 Sep 2025 · Shopify App Store)
On technical problems, a Smile.io merchant wrote: “It didn’t worked had a lot of bugs and dropped my CVR I couldn’t request a refund and its more expensive than the revenue that it got.” (TRACTION, 1★, 7 Jul 2026 · Shopify App Store)
What this means if you’re choosing a loyalty app
The reviews point to five checks worth doing before you commit:
- Test the support. Send a pre-sales question through each channel the vendor offers and note how fast and how well they answer. Ask what happens when an issue needs escalating.
- Read the pricing page past the headline number. Check order or revenue limits, which features sit on higher plans, what triggers an automatic upgrade, and the cancellation and refund terms.
- Install on a development or test store first. Check the theme blocks, customer accounts, points earning, redemption at checkout, POS if you use it, and the email or SMS tools you plan to connect.
- Check how far you can customize. Look at widget placement, design controls, translations and how the rewards page fits your brand without developer help.
- If you’re switching apps, ask whether existing customers, point balances, tiers and referral history can be imported, and check them before going live.
Limitations
Published reviews aren’t a survey of all merchants. Merchants decide whether to leave a review, and vendors often ask for reviews after a good support interaction, so the sample leans positive.
Theme tags record that a topic was mentioned. We sorted mentions into praise and complaints automatically, using the star rating and the wording around the mention; a check of 50 random mentions found the praise label right in 25 of 25 cases and the complaint label in 12 of 15, while most “mixed” mentions were in fact praise. Keyword rules can still miss or over-count some mentions, and common words like “help” and “team” probably push the support figure up.
Capping each app at 200 reviews keeps large apps from dominating, but it means smaller apps rest on less evidence.
Switching shows up mostly in the happy review a merchant leaves at their new app. Merchants rarely announce in a review that they’re leaving, so the switching figures describe successful moves, instead of churn.
Full methodology
Apps included
We included 25 apps covering points-and-rewards programs, VIP tiers, referrals, store credit, gift cards, gamified loyalty and omnichannel loyalty. We grouped them into core loyalty apps, specialist and adjacent platforms, and smaller or emerging apps. These groups are editorial and don’t imply a ranking.
Sampling
| Dataset | Reviews | Recent period | Previous period | With written comments |
|---|---|---|---|---|
| Main sample | 3,410 | 1,901 | 1,509 | 2,961 |
| One- and two-star set | 154 | 78 | 76 | 150 |
Each app could contribute up to 120 recent and 80 previous-period reviews to the main sample, and up to 60 recent and 40 previous-period reviews to the one- and two-star set. Reviews were found by reading each listing newest-first, then drawn at random within each period.
Star ratings in the main sample
| Rating | Reviews | Share |
|---|---|---|
| 5 stars | 3,220 | 94.4% |
| 4 stars | 79 | 2.3% |
| 3 stars | 12 | 0.4% |
| 2 stars | 13 | 0.4% |
| 1 star | 86 | 2.5% |
Themes and keywords
| Theme | Language tagged |
|---|---|
| Support | support, help, response, customer service, chat, team |
| Customization and branding | custom work (but not “customer”), branding, themes, widgets, design, language, developer work |
| Rewards mechanics | loyalty, points, rewards, VIP, tiers, referrals, memberships, cashback, store credit, gift cards |
| Setup and onboarding | setup, installation, onboarding, configuration, implementation |
| Reliability and technical issues | bugs, errors, loading, syncing, failures, performance, stability, technical issues |
| Pricing and billing | pricing, cost, fees, plans, charges, subscriptions, refunds, cancellation, upgrades |
| Integrations | integrations, connections, named platforms, email, SMS, WhatsApp, API, Flow |
| Migration and data transfer | migration, import/export, transfer, switching, customer-data movement |
| Reported outcomes | sales, revenue, retention, conversions, repeat purchases, AOV, LTV, ROI, growth, engagement |
| Redemption | redeeming or applying points, rewards, discounts, coupons, vouchers, store credit, cashback |
| POS and in-store | POS, point-of-sale, in-store, retail, physical store |
What we didn’t use
We used only individual review records from the Shopify App Store. We didn’t use Shopify’s AI-generated review summaries, vendor case studies, testimonials or aggregate star ratings as evidence.
Hand-checked analyses
Six findings go beyond keyword tagging. Reasons behind each praise or complaint (Finding 14) were matched with reason phrases and spot-checked: 25 of 32 random labels were correct. We read all 150 written one- and two-star reviews and coded each complaint by type, and we read every review that mentioned uninstalling, cancelling, exporting or losing data. For switching, we read every review that matched switching language or named another app, and kept only genuine moves between apps. For business results, we read every review with outcome language and kept only those describing an actual result for the merchant’s own store, not general praise or hopes. For support agents, we matched reviews against a list of first names found in the reviews and checked the matches by hand for false positives.
Margins of error
All ranges are 95% confidence intervals (Wilson method), treating each set as a simple random sample. Because reviews were sampled within apps, true uncertainty is somewhat wider, so read differences of a point or two in the main sample, or under about 10 points in the one- and two-star set, as no real difference.
| Figure | Base | Estimate | 95% range |
|---|---|---|---|
| Mention support | 2,961 written | 70.6% | 69.0–72.2% |
| Mention rewards mechanics | 2,961 | 27.2% | 25.6–28.8% |
| Mention setup | 2,961 | 19.7% | 18.3–21.2% |
| Mention reliability | 2,961 | 17.8% | 16.5–19.2% |
| Mention customization | 2,961 | 13.8% | 12.6–15.1% |
| Mention integrations | 2,961 | 8.4% | 7.4–9.4% |
| Mention pricing | 2,961 | 7.7% | 6.8–8.7% |
| Mention business results | 2,961 | 6.8% | 5.9–7.8% |
| Name a support agent | 2,961 | 33.7% | 32.0–35.4% |
| Describe switching from another app | 2,961 | 2.0% | 1.5–2.6% |
| Describe a concrete business result | 2,961 | 1.4% | 1.1–1.9% |
| Five-star rating | 3,410 reviews | 94.4% | 93.6–95.1% |
| One- or two-star rating | 3,410 | 2.9% | 2.4–3.5% |
| Support mentions that are complaints | 2,091 mentions | 2.6% | 2.0–3.4% |
| Reliability mentions that are complaints | 527 | 11.2% | 8.8–14.2% |
| Pricing mentions that are complaints | 228 | 22.8% | 17.8–28.7% |
| One- and two-star reviews mentioning support | 150 written | 46.7% | 38.9–54.6% |
| One- and two-star reviews mentioning pricing | 150 | 43.3% | 35.7–51.3% |
| One- and two-star reviews mentioning reliability | 150 | 36.7% | 29.4–44.6% |
| Complaint: slow or unhelpful support (hand-coded) | 150 | 39.3% | 31.9–47.3% |
| Complaint: pricing, plans or billing (hand-coded) | 150 | 38.0% | 30.6–46.0% |
| Complaint: bugs or not working (hand-coded) | 150 | 31.3% | 24.5–39.1% |
| One- or two-star share, 1+ year of use | 913 reviews | 4.7% | 3.5–6.3% |
| One- or two-star share, under 1 year of use | 2,491 | 2.2% | 1.7–2.9% |
| Pricing: one- and two-star vs all written reviews | ratio | 5.6× | 4.5–7.0× |
App-level figures rest on 40 to 200 written reviews each, so they carry margins of roughly ±6 to ±15 points. Compare an app with the category average only when the gap is large.
Appendix: reasons behind praise and complaints
For each theme, the reasons merchants give when they praise it or complain about it. Shares add up to more than 100% because one mention can give several reasons. The method and accuracy check are under Finding 14.
1. Support
Why merchants praise support · 1965 praise mentions
| Reason | Mentions | Share |
|---|---|---|
| Fast replies | 816 | 42% |
| Help with setup or migration | 411 | 21% |
| Friendly and patient | 278 | 14% |
| Knowledgeable or clear | 276 | 14% |
| Solved the problem | 272 | 14% |
| Did custom work | 248 | 13% |
| A real person, not a bot | 21 | 1% |
| No specific reason given | 642 | 33% |
BLOY Loyalty, on fast replies: “Very user-friendly app, offering comprehensive features, with fast and friendly customer support.” (ZEEHOO, 5★, 21 Apr 2025 · Shopify App Store)
Why merchants complain about support · 82 complaint mentions
| Reason | Mentions | Share |
|---|---|---|
| Slow or no reply | 29 | 35% |
| Didn’t fix the problem | 11 | 13% |
| Chatbot or scripted answers | 8 | 10% |
| Limited hours or plan-gated support | 5 | 6% |
| Rude or dismissive | 3 | 4% |
| No specific reason given | 39 | 48% |
Rise Gift Cards & Store Credit, on slow or no reply: “Very difficult to use. Does not support stores with subdomains. Also encountered problems, customer service support was very slow to respond. Not recommended!!” (GOELIA, 1★, 5 Dec 2024 · Shopify App Store)
2. Pricing
Why merchants praise pricing · 165 praise mentions
| Reason | Mentions | Share |
|---|---|---|
| Good value or affordable | 35 | 21% |
| Free plan | 19 | 12% |
| Lots included for the price | 17 | 10% |
| Support sorted a billing issue | 16 | 10% |
| Cheaper than other apps | 5 | 3% |
| No specific reason given | 86 | 52% |
CWILL Loyalty, on good value or affordable: “Sherm was a pleasure to work with, great new app! Moved from another provider to this one, prefer it and pricing is reasonable.” (GameStore.mt, 5★, 3 Apr 2025 · Shopify App Store)
Why merchants complain about pricing · 76 complaint mentions
| Reason | Mentions | Share |
|---|---|---|
| Too expensive | 23 | 30% |
| Charges, refunds or cancelling | 22 | 29% |
| Features behind a higher plan or order limits | 19 | 25% |
| Price rise or plan change | 9 | 12% |
| Misleading pricing | 9 | 12% |
| No specific reason given | 17 | 22% |
Rivo, on too expensive: “It’s very expensive and has no effect. I want to request a refund, but it’s not loading.” (isuvio, 1★, 11 Nov 2025 · Shopify App Store)
3. Reliability
Why merchants praise reliability · 438 praise mentions
| Reason | Mentions | Share |
|---|---|---|
| Issue fixed quickly | 247 | 56% |
| Works without issues | 63 | 14% |
| Fast, doesn’t slow the store | 32 | 7% |
| No specific reason given | 123 | 28% |
Appstle Loyalty, on issue fixed quickly: “they are the best and support team is great. they are so polite. always respond quicky and fix the issue” (L`Adore Tokyo, 5★, 15 Jan 2025 · Shopify App Store)
Why merchants complain about reliability · 75 complaint mentions
| Reason | Mentions | Share |
|---|---|---|
| Bugs, glitches or errors | 22 | 29% |
| Slow or not loading | 14 | 19% |
| Points, emails or sync not working | 14 | 19% |
| Didn’t work at all | 8 | 11% |
| No specific reason given | 34 | 45% |
Love Loyalty, on bugs, glitches or errors: “Overall, I would recommended the app! There is a glitch (or maybe it’s just room for improvement) but I will start with the pros!” (To Phōs Candles, 5★, 15 Nov 2024 · Shopify App Store)
4. Setup
Why merchants praise setup · 541 praise mentions
| Reason | Mentions | Share |
|---|---|---|
| Guided onboarding or help | 398 | 74% |
| Easy or quick to set up | 378 | 70% |
| Migration or import done for them | 34 | 6% |
| No specific reason given | 36 | 7% |
Appstle Loyalty, on guided onboarding or help: “This app is feature-packed and the expert staff is there to help implement it in a way that enhances the customer experience.” (AmeriLuxe Essentials, 5★, 3 Mar 2026 · Shopify App Store)
Why merchants complain about setup · 32 complaint mentions (small base, labels less reliable)
| Reason | Mentions | Share |
|---|---|---|
| Setup failed or wouldn’t work | 8 | 25% |
| Slow onboarding | 6 | 19% |
| Hard or confusing setup | 5 | 16% |
| No specific reason given | 16 | 50% |
Okendo Loyalty, on setup failed or wouldn’t work: “Got a 404 error after installing – app not visible/usable.” (Anarky Creations, 1★, 19 Feb 2026 · Shopify App Store)
5. Rewards
Why merchants praise rewards · 739 praise mentions
| Reason | Mentions | Share |
|---|---|---|
| Flexible program options | 221 | 30% |
| Customers like and use it | 61 | 8% |
| Easy redemption | 42 | 6% |
| Works in store too (POS) | 13 | 2% |
| No specific reason given | 454 | 61% |
BLOY Loyalty, on flexible program options: “The level of customization, the offerings, the integrations, and specially the support, make this the best loyalty app you will ever find.” (FranSweetsCo, 5★, 14 Jan 2026 · Shopify App Store)
Why merchants complain about rewards · 46 complaint mentions (small base, labels less reliable)
| Reason | Mentions | Share |
|---|---|---|
| Missing options or rules | 12 | 26% |
| Points or rewards not working | 8 | 17% |
| Redemption problems | 3 | 7% |
| No specific reason given | 27 | 59% |
YOYO Loyalty, on missing options or rules: “No points option. Only transaction discounts. NOT what I was looking for.” (Pegasus Pride, 1★, 2 Jan 2026 · Shopify App Store)
6. Customization
Why merchants praise customization · 382 praise mentions
| Reason | Mentions | Share |
|---|---|---|
| Support did the custom work | 166 | 43% |
| Easy to match the brand | 127 | 33% |
| Lots of design options | 91 | 24% |
| Translations and languages | 17 | 4% |
| No specific reason given | 90 | 24% |
Joy Loyalty, on support did the custom work: “The customer service is amaizing. Hana helped me in everything I asked for, specially on the customization of the loyalty page.” (Regarde le Ciel, 5★, 6 Nov 2024 · Shopify App Store)
Why merchants complain about customization · 18 complaint mentions (small base, labels less reliable)
| Reason | Mentions | Share |
|---|---|---|
| Limited options or needs a developer | 6 | 33% |
| Language or translation problems | 4 | 22% |
| Changes don’t show or save | 3 | 17% |
| No specific reason given | 9 | 50% |
Rise Gift Cards & Store Credit, on limited options or needs a developer: “Please note that the app cannot be translated! This means it is only suitable for stores whose main language is English. A minor but very important detail.” (Thermal Decor, 1★, 18 Dec 2025 · Shopify App Store)
How to cite this study
You’re welcome to use any figure from this study. Please credit Magicbean and link to this page:
Source: Magicbean, Shopify Loyalty App Reviews Study (2026)
For one- and two-star figures, say they come from the separate set of low-rated reviews. For an individual app’s figures, link to the app-by-app results.
About the author
Ashish Shah is the Growth & Content Lead at Magicbean and led this study
Frequently asked questions
What do merchants care about most in a Shopify loyalty app?
In our sample, support. 70.6% of written reviews mentioned support, compared with 27.2% for rewards features like points and VIP tiers and 13.8% for customization. Almost all of those support mentions (94%) are praise.
Why do merchants leave negative reviews for loyalty apps?
When we read all 150 written one- and two-star reviews, the most common complaints were slow or unhelpful support (39.3%), pricing, plans or billing (38.0%), and bugs or the app not working (31.3%).
Are Shopify loyalty app reviews mostly positive?
Yes. 94.4% of the reviews we sampled were five-star and only 2.9% were one or two stars. Three-star reviews were rare (0.4%), so most merchants either rate an app at the top or at the bottom.
Do loyalty apps increase sales and repeat orders?
This study can’t prove it either way. 6.8% of written reviews used outcome language, but only 1.4% described an actual result for the merchant’s store, most often more repeat purchases or better retention. Only 3 reviews gave a number. These are merchants’ own accounts, not measured outcomes.
Why do merchants switch loyalty apps?
In the 59 reviews that describe a switch, merchants talk most about the help they got moving over: 86% praise the support or migration team. 22% mention price or cost savings. Yotpo, Smile.io and Stamped were the apps named most often as the one left behind.
How long have merchants used an app when they review it?
Not long, usually. 28.8% of reviews are written within a week of installing and the median reviewer had used the app for about two months. Reviews from merchants with over a year of use are twice as likely to be one or two stars.
What goes wrong when merchants uninstall a loyalty app?
17 reviews describe a problem: being charged after uninstalling or cancelling (5), code or data left on the store (4), reviews, points or customer data lost after a plan change (4), trouble exporting (2), not being able to uninstall (1) and customers not carried over in a migration (1). It’s a small base, so check cancellation terms and export options yourself before installing.
Is this study a ranking of loyalty apps?
No. It shows which topics merchants mention for each app and how many of those mentions are praise or complaints. Raw counts also reflect how many reviews each app gets, so they shouldn’t be read as a ranking.
Why does the study use 3,410 reviews and not every review?
We capped each app at 200 reviews, sampled at random from the last two years, so that large apps with thousands of reviews don’t outweigh smaller ones and the results reflect the current versions of each app.